The Turtle Channel Indicator MT4 automatically draws support and resistance levels based on the recent highs and lows of candlesticks. It provides three levels of support/resistance: short-term, medium-term, and long-term, depending on the number of candles you select.
Trading with the Turtle Channel is a popular method. Traders use the support and resistance levels generated by the Turtle Channel as trend channels to identify potential entry and exit points.
Turtle Channel Indicator – Functions
This indicator plots the upper and lower bands, which act as support and resistance zones. You can also use them to identify potential overbought and oversold areas for possible reversal trades.
Let’s take a closer look at this indicator through the chart below.
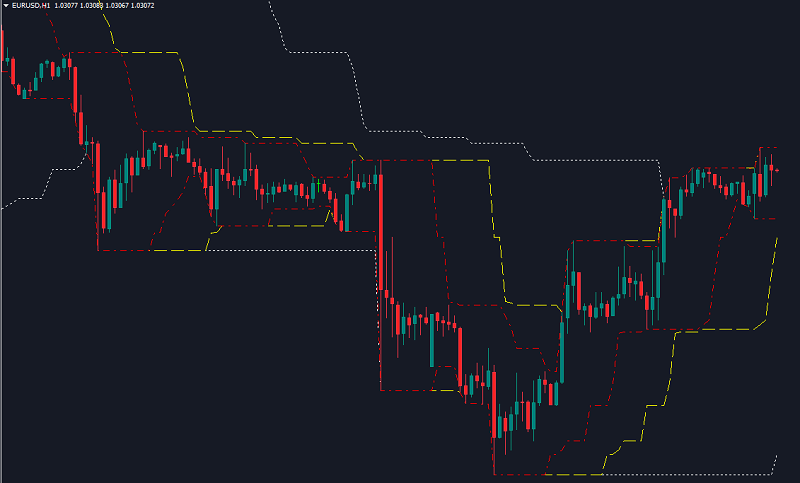
In this indicator, there are three support/resistance lines, each shown in a different color:
-
Red line: Short-term support/resistance, based on the highs and lows of x most recent candlesticks.
-
Yellow line: Medium-term support/resistance, based on the highs and lows of y most recent candlesticks (y > x).
-
White line: Long-term support/resistance, based on the highs and lows of z most recent candlesticks (z > y > x).
The values of x, y, z candlesticks can be customized according to your preference.
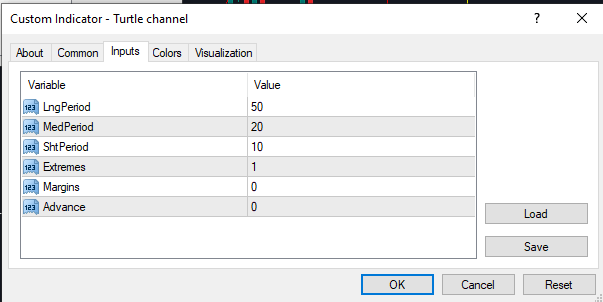
- Lng Period: Long-term
- Med Period: Medium-term
- Sht Period: Short-term