Half Trend Buy Sell Indicator MT4 helps you quickly identify market trend reversals so you can enter early into a newly forming trend.
Previously, IndicatorShare introduced the Super Trend Indicator, which helps traders spot market trend changes quickly, and the Half Trend Buy Sell is a similar type of indicator. Let’s explore the power of this indicator in the sections below.
Oh, and if you’re in a hurry, make sure to at least read the Installation Guide at the end of this article, as it contains an important piece of information directly related to the performance of this indicator.
Introduction to Half Trend Buy Sell Indicator MT4
Do you spend a lot of time watching charts every trading day just to find an entry opportunity?
If your answer is yes, then the Half Trend Buy Sell Indicator can be useful in helping you avoid constantly staring at your MT4 screen while still making sure you don’t miss trading opportunities. With this indicator, you can:
-
Receive alerts of potential reversal opportunities for trade entries.
-
Avoid constant monitoring of MT4 while still being “present” at the key moments → freeing up time for other tasks.
-
Rely on a non-repainting, trustworthy indicator.
-
Use it on any timeframe and any currency pair.
The working principle of this indicator is based on moving averages, making it highly effective since moving averages are one of the most widely proven methods to identify market trends today.

How to Use the Half Trend Buy Sell Indicator
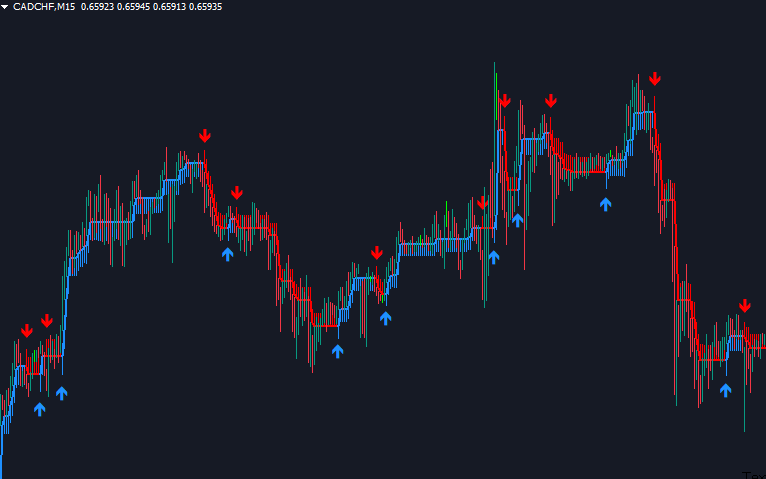
After installing the Half Trend Buy Sell Indicator, it will plot a moving average line with the following conventions:
-
A blue line indicates an uptrend → you should only look for BUY opportunities.
-
A red line indicates a downtrend → you should only look for SELL opportunities.
Additionally, for each trend change, an arrow will appear showing a BUY/SELL signal with the corresponding colors: Blue (BUY) and Red (SELL).
Note 1:
When the trend changes, you can wait for the price to pull back to the trend line before entering a trade. This helps you get a better entry point and also avoid “choppy” markets (markets with no clear trend).
Note 2:
You can use this indicator independently or in combination with other indicators.
For example, in the chart below, I combined it with the SMA 200, meaning:
-
Use SMA 200 as the main trend filter:
-
If price is above SMA 200, the market is in an uptrend → only look for BUY trades.
-
If price is below SMA 200, the market is in a downtrend → only look for SELL trades.
-
-
Only take signals from the Half Trend Buy Sell Indicator that are in line with the main trend (as defined by SMA 200).
Installation Guide for Half Trend Buy Sell Indicator
The most important setting directly affecting this indicator’s performance is Amplitude.
-
The higher the Amplitude value, the greater the delay in detecting trend changes. This means the indicator provides more accurate trend identification but reacts more slowly to price movements.
-
Conversely, a lower Amplitude makes the indicator more sensitive to price changes, but it may also produce more false signals.
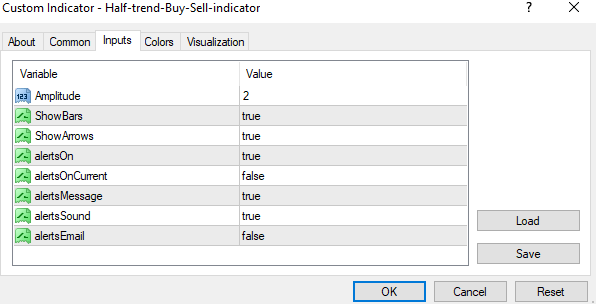
Let’s take a look at the difference with two different settings:
Amplitude =2:
Amplitude =10:
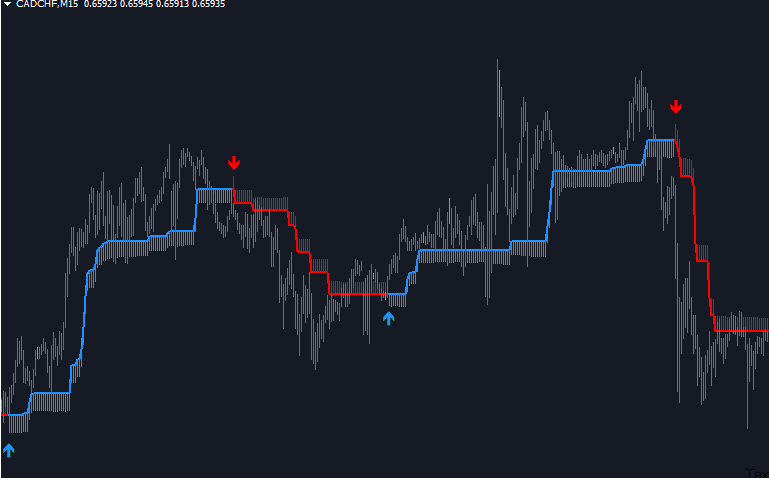
As you can see, with Amp = 10, the trend looks smoother, doesn’t it? Therefore, you should experiment with adjusting this parameter to find the value that best fits your own trading strategy.