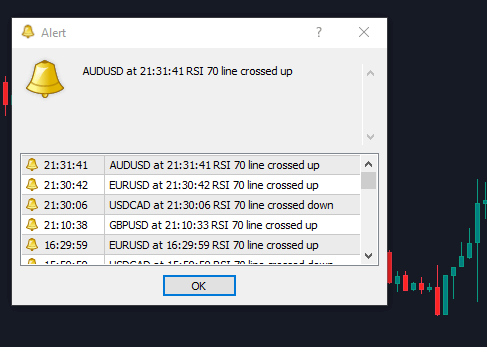
One of the main uses of the RSI is its ability to quickly identify overbought and oversold zones. The Color RSI with Alert indicator provides alerts (sound and pop-up notifications) when the RSI value enters overbought or oversold levels, helping traders stay on top of the market without having to constantly watch the screen.
Introduction
Color RSI with Alert can be considered an upgraded version of the standard RSI (Relative Strength Index), offering several useful features:
-
Alerts when the RSI enters the overbought zone (for example, RSI > 70) or the oversold zone (for example, RSI < 30). These threshold levels (70 and 30) are fully customizable. This feature is especially useful for traders who do not want to monitor charts continuously and prefer to be notified only when price reaches important levels via sound alerts.
-
On-chart arrow alerts displayed on the MT4 screen (although these are optional and can be disabled, as they are not particularly useful in practice).
-
Color changes when RSI moves into overbought or oversold zones, making it much easier to visually identify these conditions at a glance.
This indicator works on all timeframes, just like the standard RSI indicator.
Color RSI with Alert – Overbought & Oversold Alerts (Image)

The indicator will display notifications like the example shown below.
Indicator Installation Guide
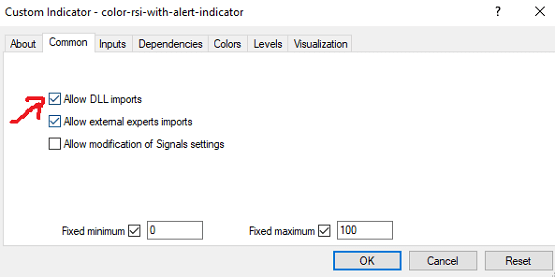
After installing the indicator as usual, make sure to check the “Allow DLL Imports” option:
Adjusting the Settings
The two most important parameters are Overbought and Oversold, which are set to 70 and 30 by default. You can adjust these levels to 80 and 20, or any values you prefer, depending on your trading style.

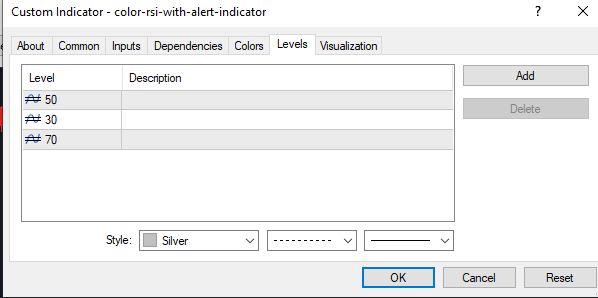
Adding Levels
Add three levels — 50, 70, and 30 — to the indicator window for better visibility.
Some Ways to Use the Indicator
Trend-Following Trading
-
In an uptrend, when the RSI drops below the 30 level, you can look for BUY opportunities.
-
In a downtrend, when the RSI rises above the 70 level, you can look for SELL opportunities.
Counter-Trend Trading
-
When the indicator sends an overbought alert (RSI > 70), you can wait for the next strong price rally and look for a SELL setup.
-
Conversely, when the indicator sends an oversold alert (RSI < 30), you can wait for the next strong price pullback and look for a BUY opportunity.
Important: Avoid counter-trend trading during high-impact (red news) events, as market volatility can invalidate RSI signals.