Understanding and applying Supply Zones and Demand Zones is the key to successful trading for many traders. The Supply and Demand Zones Indicator (MT4) helps you quickly draw supply and demand areas, allowing you to identify high-potential trade setups as well as define take-profit and stop-loss levels more effectively.
Introduction to the Supply and Demand Zones Indicator – Supply & Demand Identification Tool
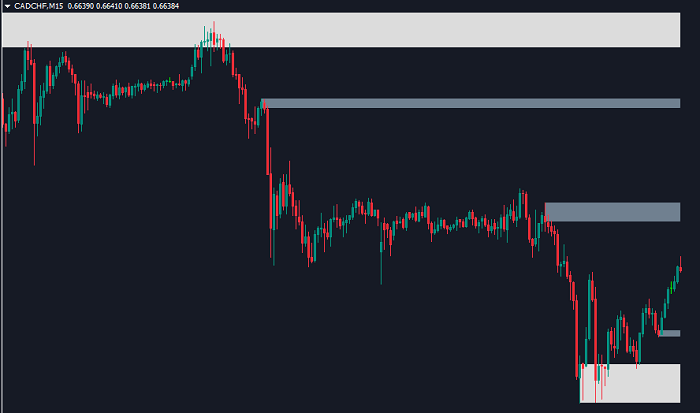
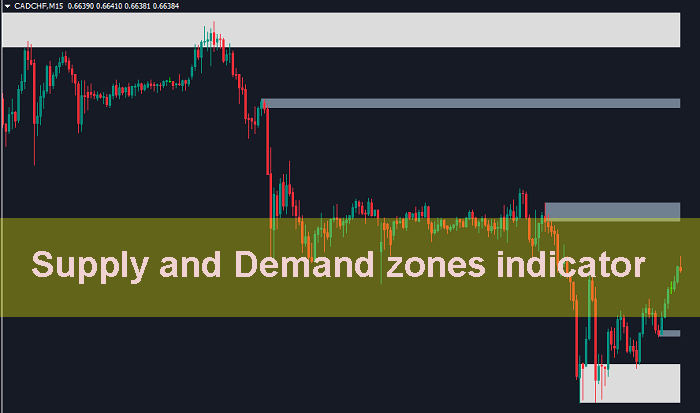
After installing the indicator, it will automatically draw supply and demand zones as rectangular boxes on the price chart.
These zones are displayed in two different colors, each with a specific meaning:
-
White rectangles: These represent supply or demand zones where price has recently reacted. Since price has reacted at least once in the recent past, these zones can be considered strong and reliable, making them suitable areas to look for potential trade entries.
-
Gray rectangles: These represent supply or demand zones that have not yet been tested by price.
You can customize the colors of these zones in the indicator’s settings according to your personal preference.
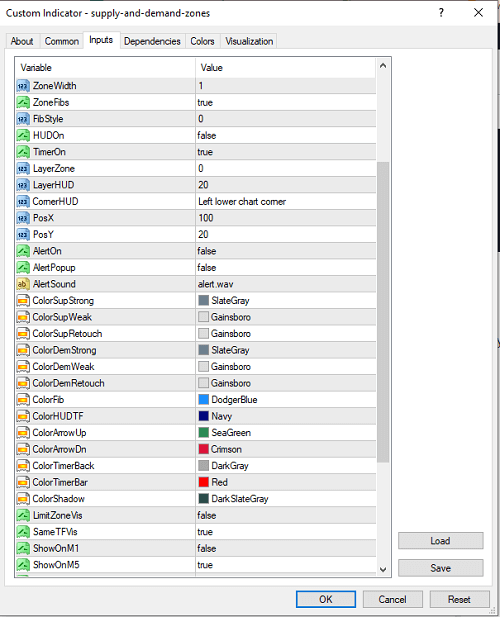
Supply and Demand Zones Indicator MT4 – Installation Guide
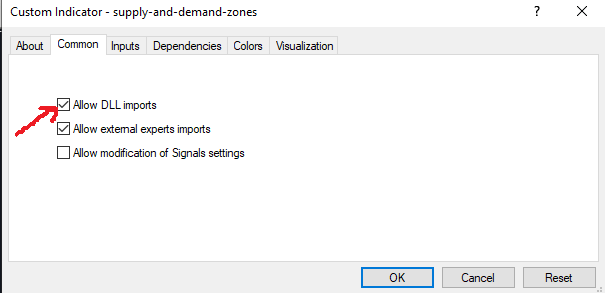
During the installation process, make sure to enable “Allow DLL Imports” so the indicator can display its data properly on MT4:
What Are Supply and Demand Zones?
Supply and demand zones are common concepts in technical analysis. They are areas on the chart where strong battles between buyers and sellers occurred before price made a significant move.
Supply Zone
When supply exceeds demand, price moves downward. This happens because selling pressure is stronger than buying pressure, creating an imbalance between sellers and buyers. Before price drops sharply, it usually consolidates, forming what is known as a supply zone.
As a result, when price later returns to this supply zone, traders often look for SELL opportunities.
Demand Zone
Conversely, in a demand zone, buyers and sellers struggle intensely before buyers gain control and push price higher. When price revisits a demand zone in the future, traders typically look for BUY opportunities.
Two Ways to Trade Using Supply and Demand Zones
Once supply and demand zones are identified, you can start applying them to your trading.
Using Supply & Demand for Take Profit and Stop Loss
This is one of the most common ways traders use supply and demand zones.
Take Profit
-
For BUY trades, when price approaches a supply zone, strong selling pressure is likely to appear. You can place your take profit at the supply zone and wait for the market’s reaction.
-
For SELL trades, when price approaches a demand zone, strong buying pressure is expected. You can place your take profit at the demand zone and observe how price reacts.
Stop Loss
-
Place stop loss for BUY trades below the demand zone
-
Place stop loss for SELL trades above the supply zone
Using Supply & Demand to Find Entry Points
Step 1: Identify Supply and Demand Zones
Mark clear supply and demand zones on the chart using price structure or a supply and demand indicator.
Step 2: Wait for Price to Reach the Zone
-
When price reaches a demand zone and a bullish reversal candle appears → place a BUY order
-
When price reaches a supply zone and a bearish reversal candle appears → place a SELL order
Discussion
Supply and demand zones are very useful tools for traders, especially swing traders. Using this indicator also helps reduce overtrading, as it requires patience—waiting for price to reach key supply or demand zones before looking for trade opportunities.